
The mologramA hologram made of molecules
A mologram arranges binding sites into a focusing diffraction pattern. Analyte binding changes the patterned mass and therefore the focal signal. The optics select a spatial pattern, not a molecular identity: specificity still depends on the recognition chemistry and controls.
Objective. Understand how patterned binding becomes a coherent focal signal. In the training: How the mologram turns binding into light.
Recommended first: Gratings and diffraction.
Text description of the animation
Guided light travels beneath the mologram. Its evanescent field illuminates recognition sites patterned on the surface. Analyte molecules from the sample bind to those sites, adding mass in step with the pattern. Light scattered from the bound molecules interferes constructively and converges to one bright focus, which the reader images as the signal. Material that is not in step with the pattern does not build the focus. The soundtrack is decorative and carries no information not in this description.
Affinity modulation: binding preference with an optical baseline
Affinity modulation means that binding preference varies across the surface. Ligands favor target binding on the ridges; the grooves provide a matched reference chemistry. The ligand layer itself can already produce coherent scattering. A nearly massless affinity pattern is an ideal, not a requirement that the focus be dark before binding.
Binding changes the complex scattered field. Ridge-preferential non-specific adsorption can imitate a target response, while adsorption shared by ridges and grooves contributes much less to the coherent signal. Reichmuth 2021.
Coherence does not identify a molecule
Optical coherence describes how scattered fields combine at the detector. Biochemical specificity describes which molecules a ligand recognizes. The detector measures the spatial pattern, not the molecular identity.
| Binding pattern | Ideal coherent contribution | Interpretation |
|---|---|---|
| Target binds preferentially to ridges | Nonzero, because binding follows the pattern. | Consistent with the intended interaction; controls still matter. |
| Non-specific adsorption is equal on ridges and grooves | Zero in the ideal balanced pattern. | Mass can still foul the surface or contribute scattering background. |
| Non-specific adsorption favors ridges | Nonzero, despite the wrong molecular identity. | Can imitate the intended binding response. |
Real finite patterns do not reject every uniform contribution perfectly. Reichmuth et al. (2021) examines how affinity matching reduces interference from complex samples.
Worked example. Streptavidin binding follows the biotin pattern. The focus alone cannot prove the added material is streptavidin; recognition chemistry and controls support that interpretation.
Ridges, grooves, and a low-fouling surface
Ridges carry the active recognition sites; grooves carry a matched, non-binding chemistry, both on a low-fouling copolymer. Matching matters more than inertness: non-specific material that lands equally on ridge and groove adds little coherent signal. The surface lesson covers the chemistry and how to test the match.
Molecules arrive over time. Specific ones bind the ridges in register and the focal spot brightens with the square of how full the ridges are. Turn on uniformly distributed non-specific binding: the ideal coherent response stays unchanged while background rises. This lab assumes matched chemistry and no initial coherent field; the surface lab shows what happens when matching fails.
How the pattern is written
The mologram is patterned into the copolymer by reactive immersion lithography. Two coherent beams interfere at the surface to project a fine fringe pattern. Where the light lands, the copolymer's chemistry is switched so that recognition sites can later be attached there. Because the pattern comes from an optical interference fringe, it can be made very fine and very regular, which is what the diffractometric readout demands.
A refinement, image-reversal lithography, sharpens the boundary between active and passive regions. Crisper ridges mean more of the bound analyte sits where it contributes coherently, raising the analyte efficiency and lowering the detection limit. Frutiger 2018.
Raise the exposure dose to develop the interference fringe into ridges. Switch to image-reversal to sharpen the ridge edges; notice the sharper spatial contrast. The drawing is a conceptual exposure model, not a manufacturing recipe or a numerical prediction of analyte efficiency.
A sense of scale
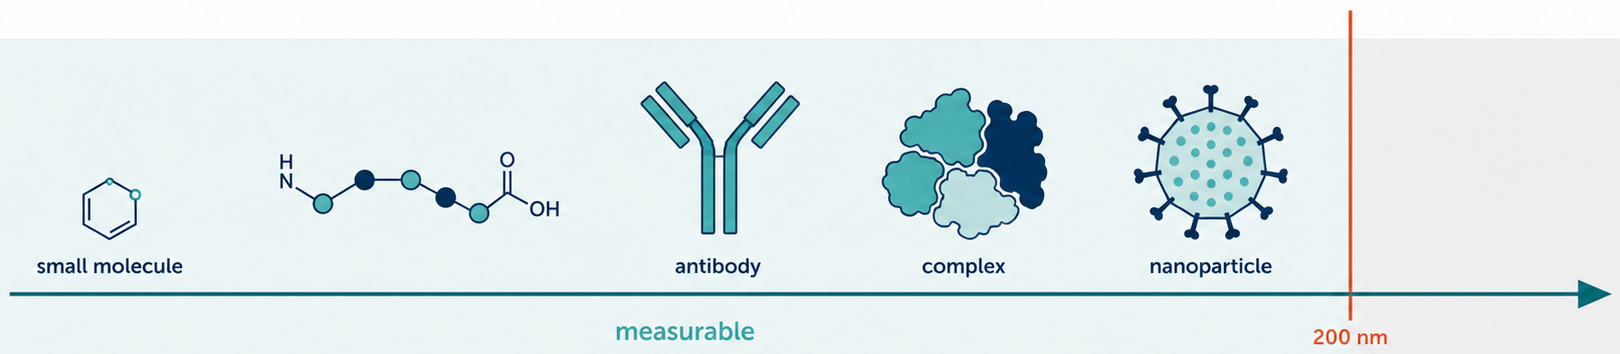
The pattern sits at the scale of the wavelength of light. The molograms are 400 µm wide with a period of a few hundred nanometers, so a mologram holds roughly a thousand periods. The figure below places the pattern against familiar sizes.
Predict before revealing the explanation. Can a molecule that does not recognize the target produce a coherent response?
Reveal the explanation
Yes. Non-specific adsorption can contribute if it favors the ridge or groove chemistry. Coherence is a spatial property, not proof of biochemical specificity.