
Instrument
The MACS® Matchmaker reads 64 molograms at once and reports binding as coherent mass density. The MACS Sampler feeds it samples for up to 72 hours without supervision.
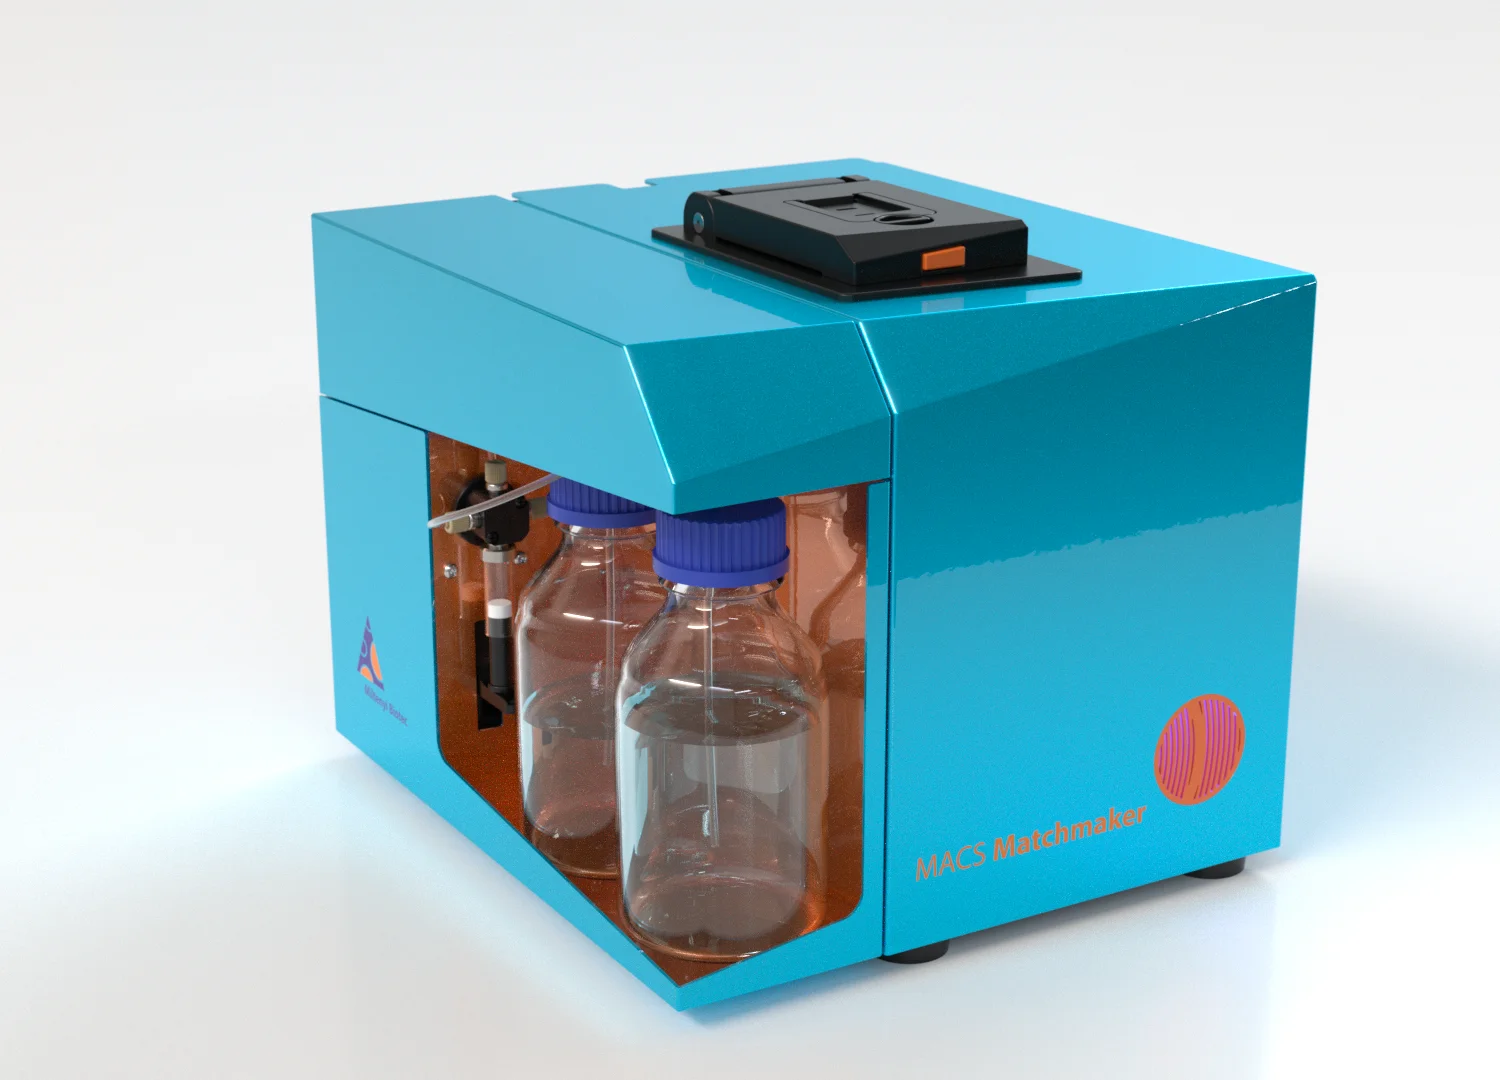
MACS Matchmaker
The reader: laser, chip holder, fluidics and cameras. It turns patterned binding on the chip into kinetics and affinity.
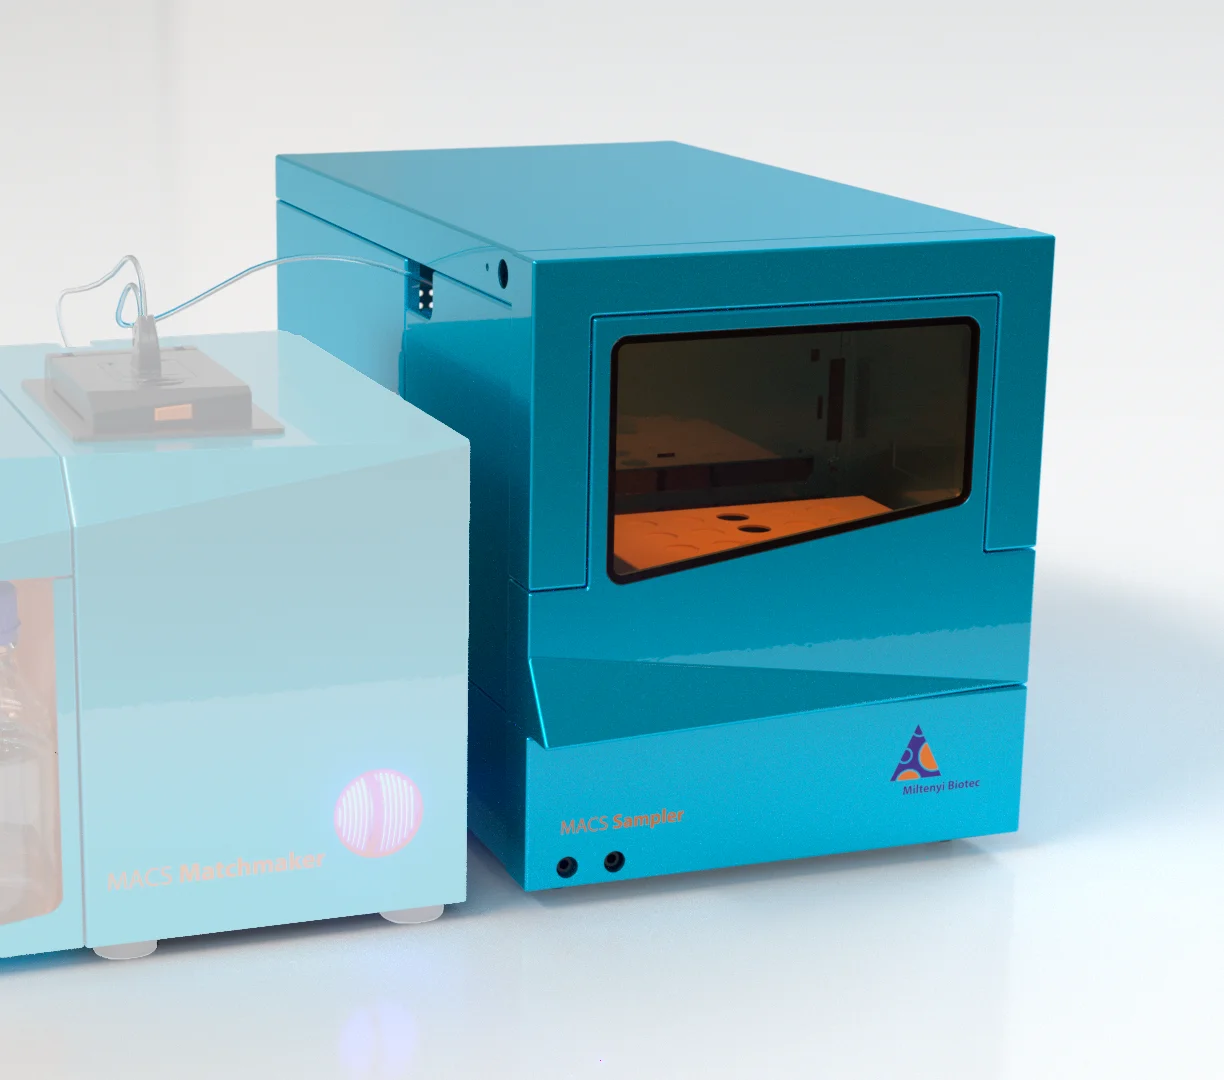
MACS Sampler
The autosampler: two 96- or 384-well plates or vial racks, cooled from 4 to 20 °C, with a metal-free sample path.
Specifications
These numbers decide whether an interaction suits the instrument. Read the ranges as a window. Near the edges, very fast association or very slow dissociation needs a design that controls mass transport and observation time.
| Property | Specification |
|---|---|
| Association rate constant | kon 103 to 108 M−1 s−1 |
| Dissociation rate constant | koff 10−6 to 1 s−1, complex half-lives from under a second to about eight days |
| Smallest analyte | 350 Da |
| Noise and drift | 0.05 pg/mm² over 20 min at 5 pg/mm²; 0.2 pg/mm² at 50 pg/mm² |
| 10% DMSO step | 1 to 2 pg/mm² |
| Analysis temperature | 25 to 60 °C; 15 to 60 °C with chiller |
| Samples | Blood, plasma, serum, cell lysate, cell culture supernatant, urine, CSF, interstitial fluid |
| Reference surface | Not required: each mologram references itself |
| Flow rate, injection volume | 6 to 1,000 µL/min; 50 to 500 µL, typically 100 µL |
| Readout frequency | 0.5 Hz |
Source: MACS Matchmaker technical specifications, lino-biotech.com, November 2026. Where these numbers come from: detection and noise.
Three readouts
| Readout | Question it answers |
|---|---|
| Coherent mass density (CMD) | Did mass accumulate in the mologram pattern? The primary trace for kinetics and affinity, in pg/mm² |
| Mass density (MD) | Did the optical environment near the surface change? Shows sample arrival, bulk shifts, bubbles and drift |
| Fluorescence | Is a fluorescent label present? Excitation at 660 nm, within 100 to 200 nm of the surface. Optional |
How the focal spot becomes these numbers: signal and quantification and the reader's optics.
One sample goes from its well through the fluidics to the chip, and the camera reads the 64 focal spots. Play the run or step through it. Then add a fluorescent label, or a matrix that adsorbs evenly, and see which readout changes.
In the animation, 100 µL at 20 µL/min gives 300 s of contact, after 60 s and before 540 s of buffer. The analyte binds five of the eight ligands, each to its own level, by a 1:1 model. The traces show mologram 01.
Throughput
- 64 molograms per chip, read in parallel. Use them for up to 64 ligands, or as replicates and references. More ligands per chip means fewer replicates each; see multiplexing.
- Up to 1,536 interactions a day, with DNA-directed immobilization (DDI) in batches of 64 compounds against one target.
- 72 hours unattended with the MACS Sampler.
The stated 1,536 a day are 24 batches of 64, so one batch an hour. How far a load of plates goes depends on how many wells one run draws and how long it takes. Count every well a run uses, for example the ligand pool and each analyte concentration.
Your settings are inputs, not specifications. Both plates have the same format. Each run first loads the ligands from their own wells (with DDI, the pre-incubated adapter pool), then injects the analyte series. Each run gives one interaction per ligand on the chip. Press "Run the plates" to watch the wells empty, run by run.
Data and software
Automated analysis fits kon, koff and KD, and keeps surface and fluorescence images with each run. Python in JupyterHub is available for custom analysis. Results export to CSV, Excel and PDF, and the instrument is controlled from a browser. Operation and analysis are described in the documentation.