
Small molecules
Measure kon, koff and KD of a small molecule without a label: the target sits on the chip and the compound flows over it.
The question
How fast does my compound bind and release its target, and how strongly?
Coherent mass density (CMD) reports bound mass, so a small molecule gives a small signal. Here the target is on the chip and the compound is the analyte. If the compound carries DNA, as a DEL hit does, put the compound on the chip and use the protein as the analyte. DEL hit validation shows that format, with selectivity and off-target profiling.
The setup
| Chip | A 1-plex chip: carbonic anhydrase II (CA-II) on all 64 molograms |
|---|---|
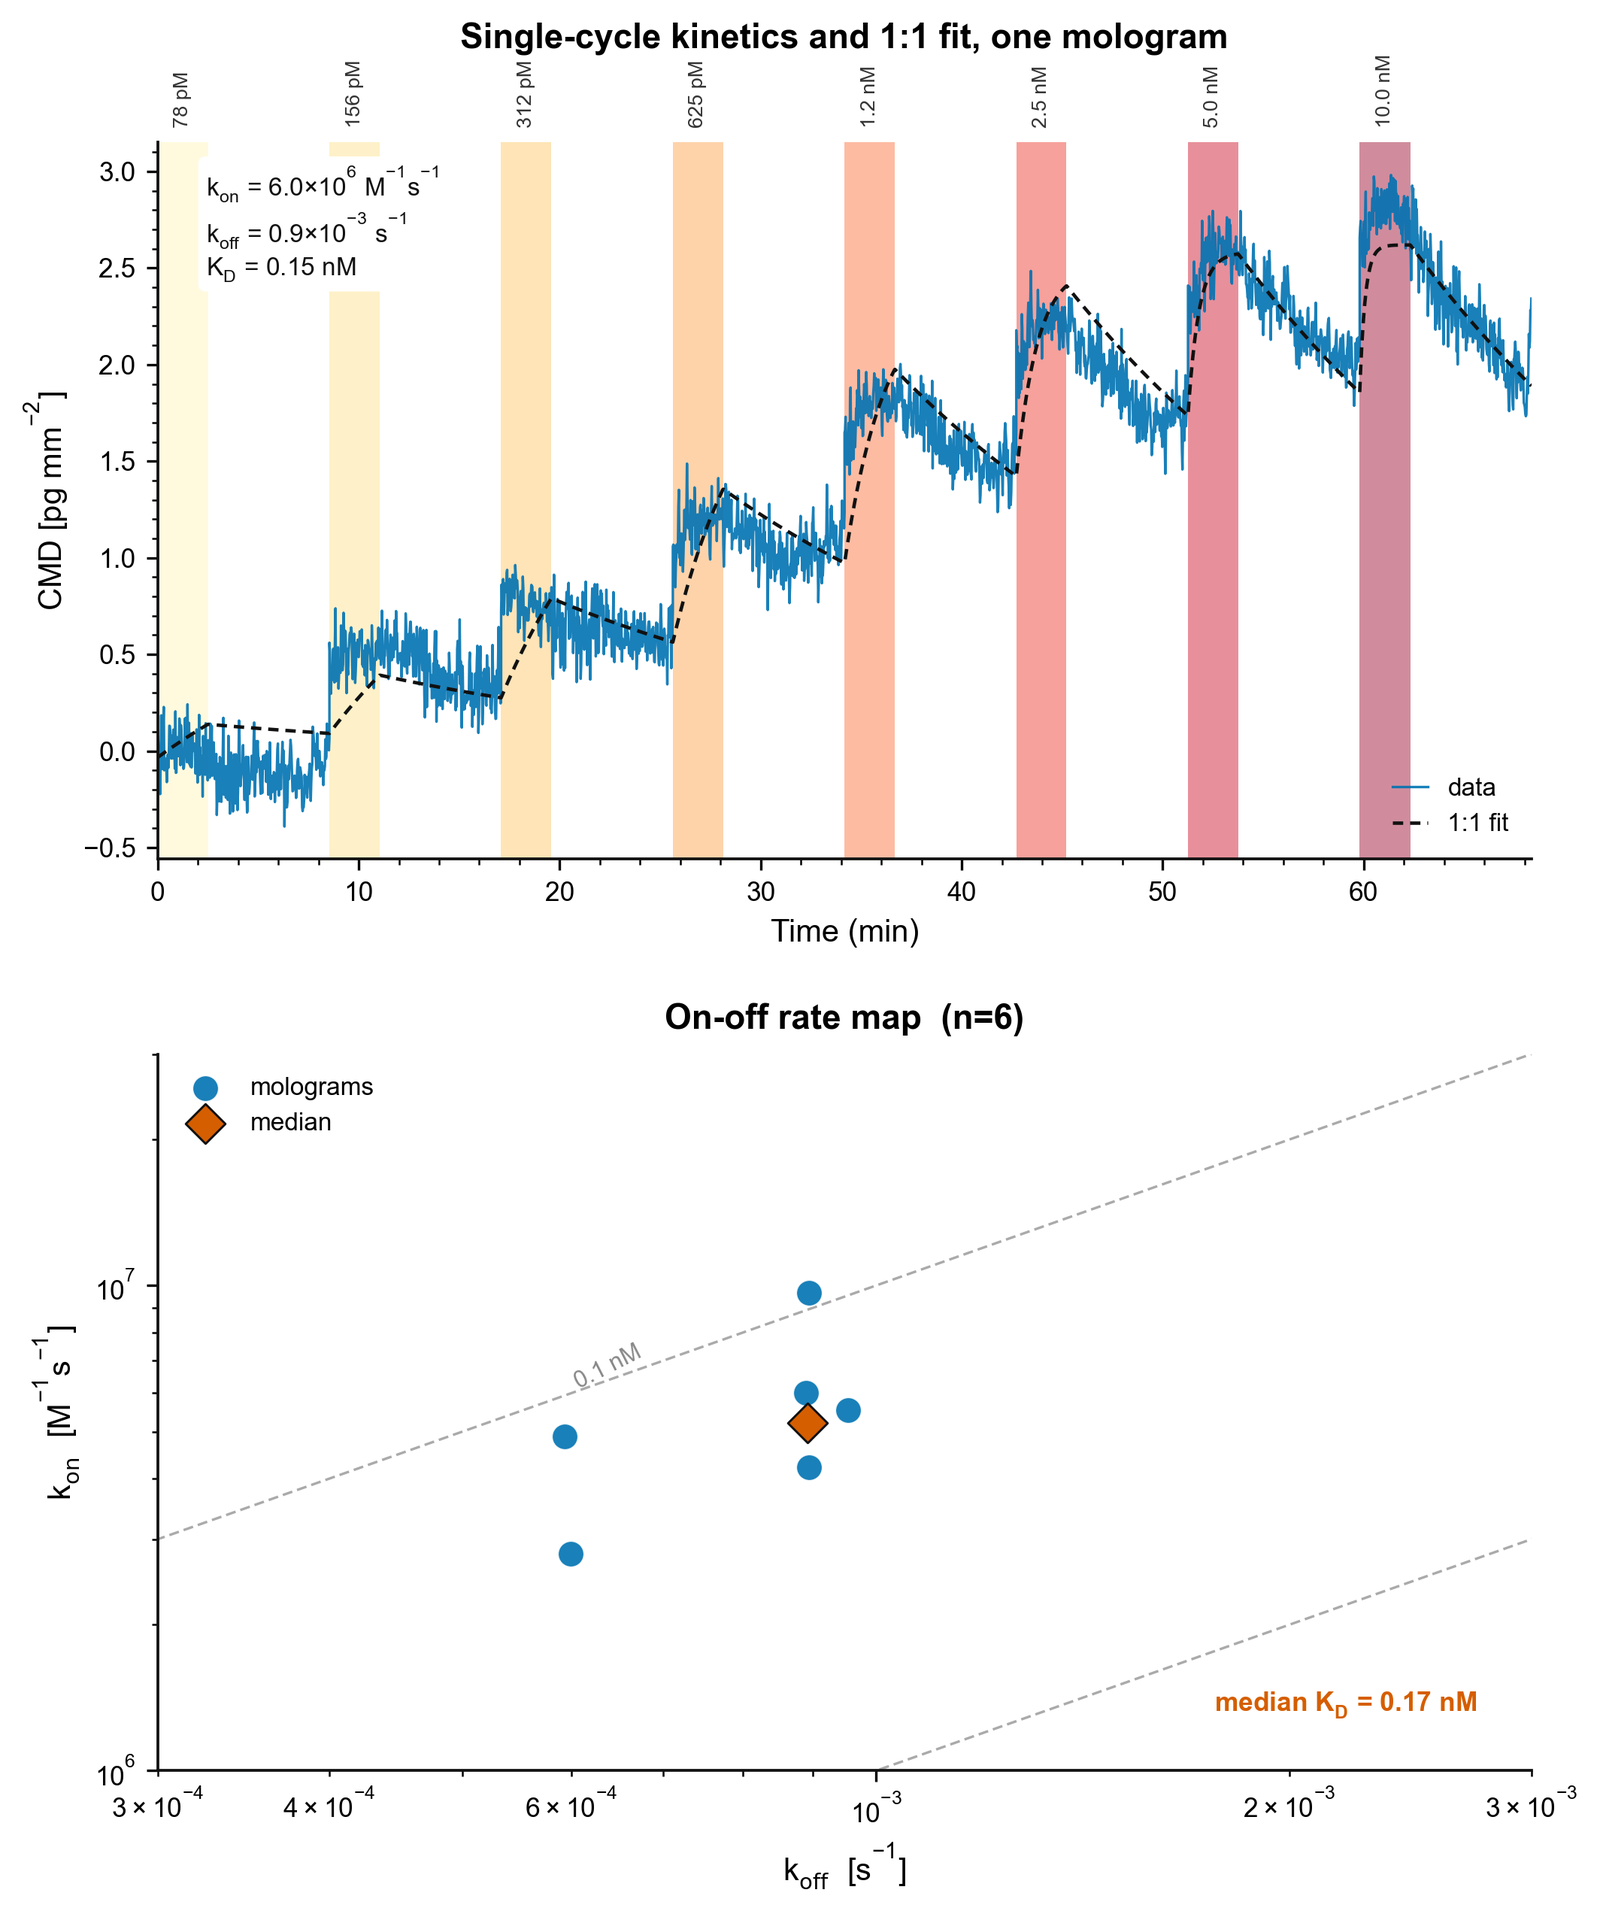
| Analyte | Dorzolamide (324 Da), a sulfonamide CA inhibitor. Eight 2-fold steps from 78 pM to 10 nM, 150 s each |
| Assay | Single-cycle kinetics (SCK), 1:1 fit on the 6 molograms with clean traces |
Measured result
How to read it
- The small molecule gives a clear kinetic signal. Each step from 78 pM to 10 nM adds bound mass, and dissociation is visible between steps. The full titration reaches about 3 pg/mm².
- The fit gives sub-nanomolar affinity. The 1:1 SCK fit on 6 molograms gives a median KD of about 0.17 nM, ranging from 0.09 to 0.21 nM. The rate constants are kon about 5 × 10⁶ M−1 s−1 and koff 6 to 9.5 × 10⁻⁴ s−1.
- What it does not show. This is one compound on one target. The CA-II fit uses 6 of 64 molograms, chosen for clean traces. At 324 Da, dorzolamide is below the 350 Da lower limit in the specification. Plan routine assays with the 350 Da limit.
How large is the signal?
Each bound analyte adds its own mass. If every ligand binds one analyte, the maximum response is the ligand level times the mass ratio of analyte to ligand. A 324 Da compound on a protein ligand gives a response hundreds of times smaller than an antibody on the same ligand. Compare that response with the noise of the instrument.
Set the analyte mass, the ligand mass and the ligand level. Analytes land on the ligands of the ridges; the grooves carry backfill and bind nothing. The scale on the right compares the maximum response with the specified noise. It starts at the measured pair above: dorzolamide on CA-II (29 kDa) in a dense ligand layer. The measured 3 pg/mm² is about two thirds of that maximum. The buttons show the documentation example level.
Rmax = (MWanalyte / MWligand) × ligand level × stoichiometry, from the experiment design documentation. The lab uses a stoichiometry of 1 and a fully active ligand. The ligand level is the immobilization level in pg/mm²; a protein monolayer gives about 400 pg/mm² of CMD. The noise line is the specified 0.05 pg/mm² over 20 minutes at 5 pg/mm². At 50 pg/mm², the specified noise is 0.2 pg/mm². The orange line marks the measured dorzolamide result above, about 3 pg/mm².
Why it works
The ridges and the grooves of a mologram sit about 200 nm apart and see the same solution. A DMSO or buffer step changes both equally and cancels; a 10% DMSO step adds only 1 to 2 pg/mm². Specified noise and drift of 0.05 pg/mm² over 20 minutes keep a response of a few pg/mm² readable. When the compound sits on the chip, the protein is the analyte and gives the larger signal.
Read more: why DMSO and bulk steps cancel, what limits small analytes, and how bound mass becomes coherent mass density.
More
- Compounds on DNA: DEL hit validation in this academy, and encoded library screening
- Products: 1-plex chips for one target on all 64 molograms
- Training: From small molecules to cells and The numbers that decide fit
- Documentation: Assay types