
Kinetics and thermodynamics
Measure how fast a binder associates and dissociates, how tightly it binds at equilibrium, and what drives the binding. Repeat the run at several temperatures and the same chip gives enthalpy and entropy.
The question
How fast does it bind and release, and is the binding driven by enthalpy or by entropy?
Two binders with the same KD can differ in their rate constants and in how the binding energy splits into enthalpy and entropy. These differences guide which analog to develop. Very slow dissociation is a separate challenge: the baseline must stay stable for hours to see it.
The setup
| Study 1: cAMP analogs | Five cAMP derivatives (6-AH, 8-AHA, 8-AEA, 8-ADOA and 2-AHA-cAMP) on DNA, placed by DNA-directed immobilization (DDI) on a DNA chip. The analyte is the regulatory subunit RIα of protein kinase A (PKA-R) |
|---|---|
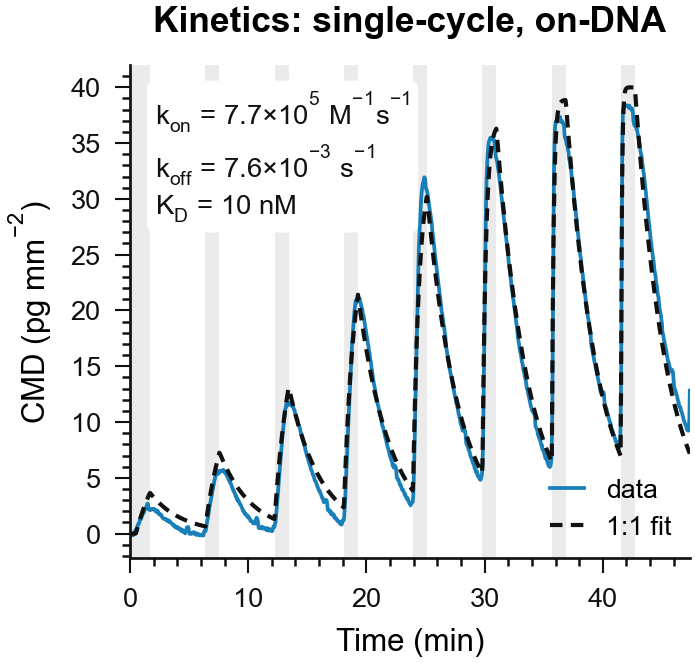
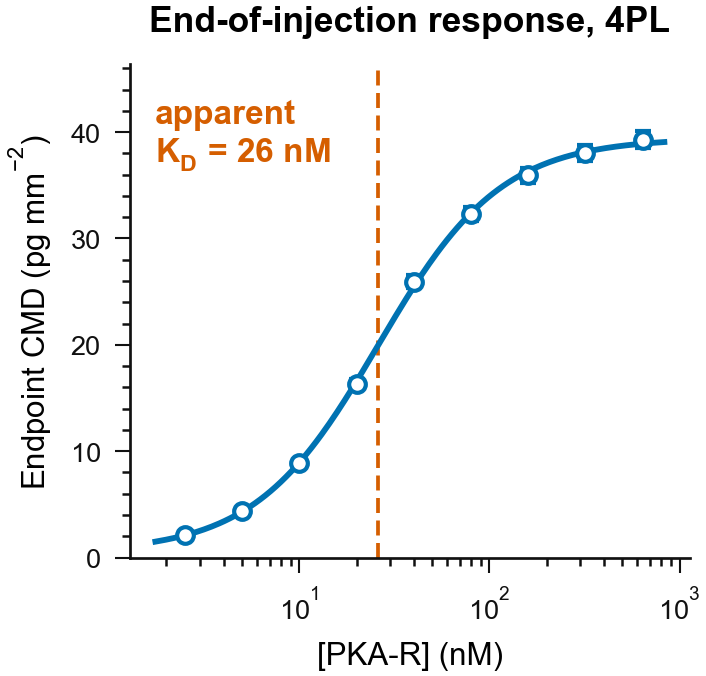
| Assays | Single-cycle kinetics (SCK) at 15, 20, 25, 30 and 35 °C. For 6-AH-cAMP also multi-cycle kinetics (MCK) at 25 °C in MOPS buffer: nine PKA-R concentrations, 2.5 to 640 nM, on 16 molograms |
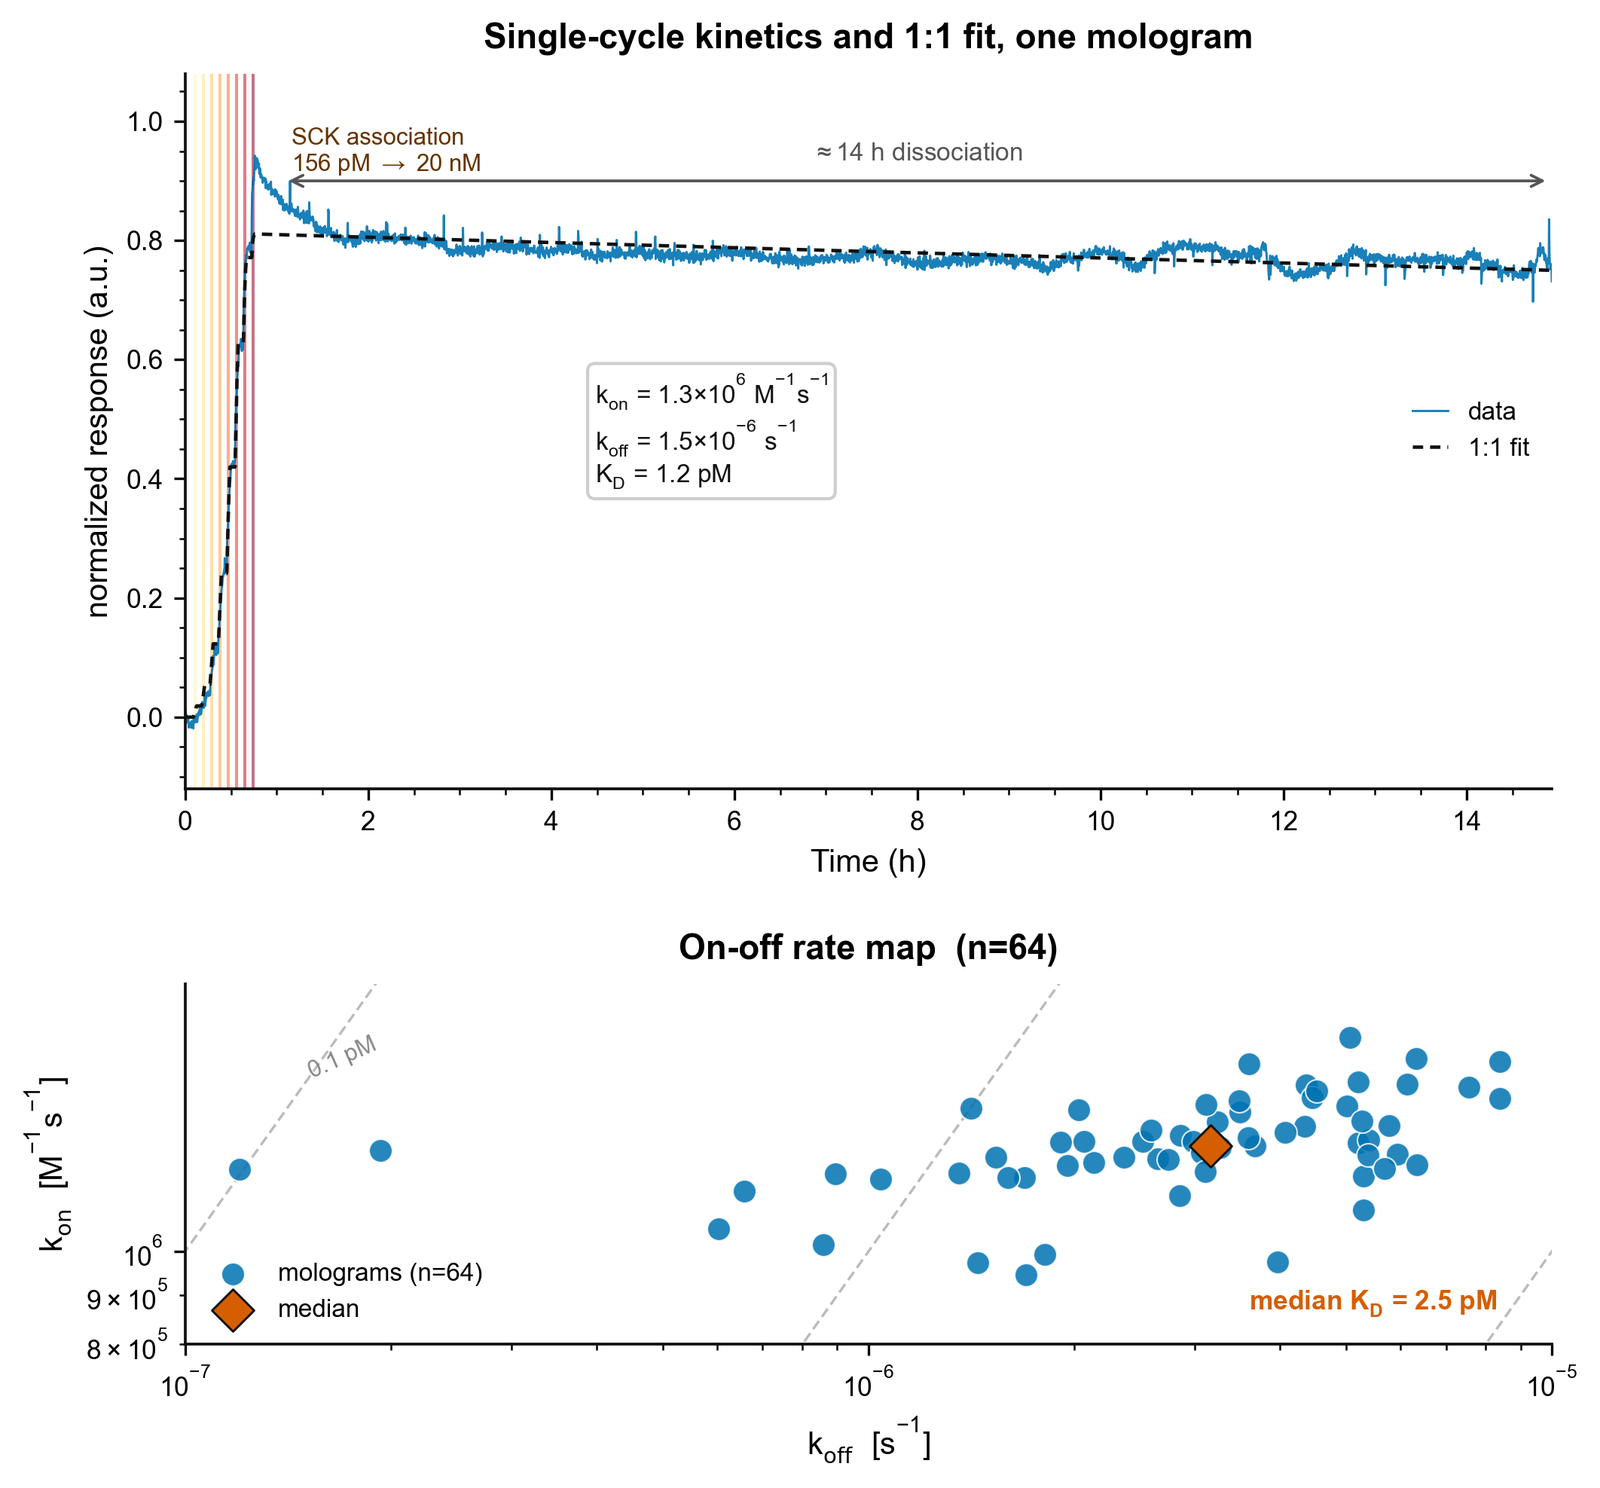
| Study 2: slow dissociation | Protein A on a DNA chip, captured through the NeutrAvidin adapter and biotin. The analyte is trastuzumab (Herceptin), 156 pM to 20 nM by SCK, then 14 h of dissociation in buffer. 64 molograms |
Measured result
Rate constants and affinity
Enthalpy and entropy
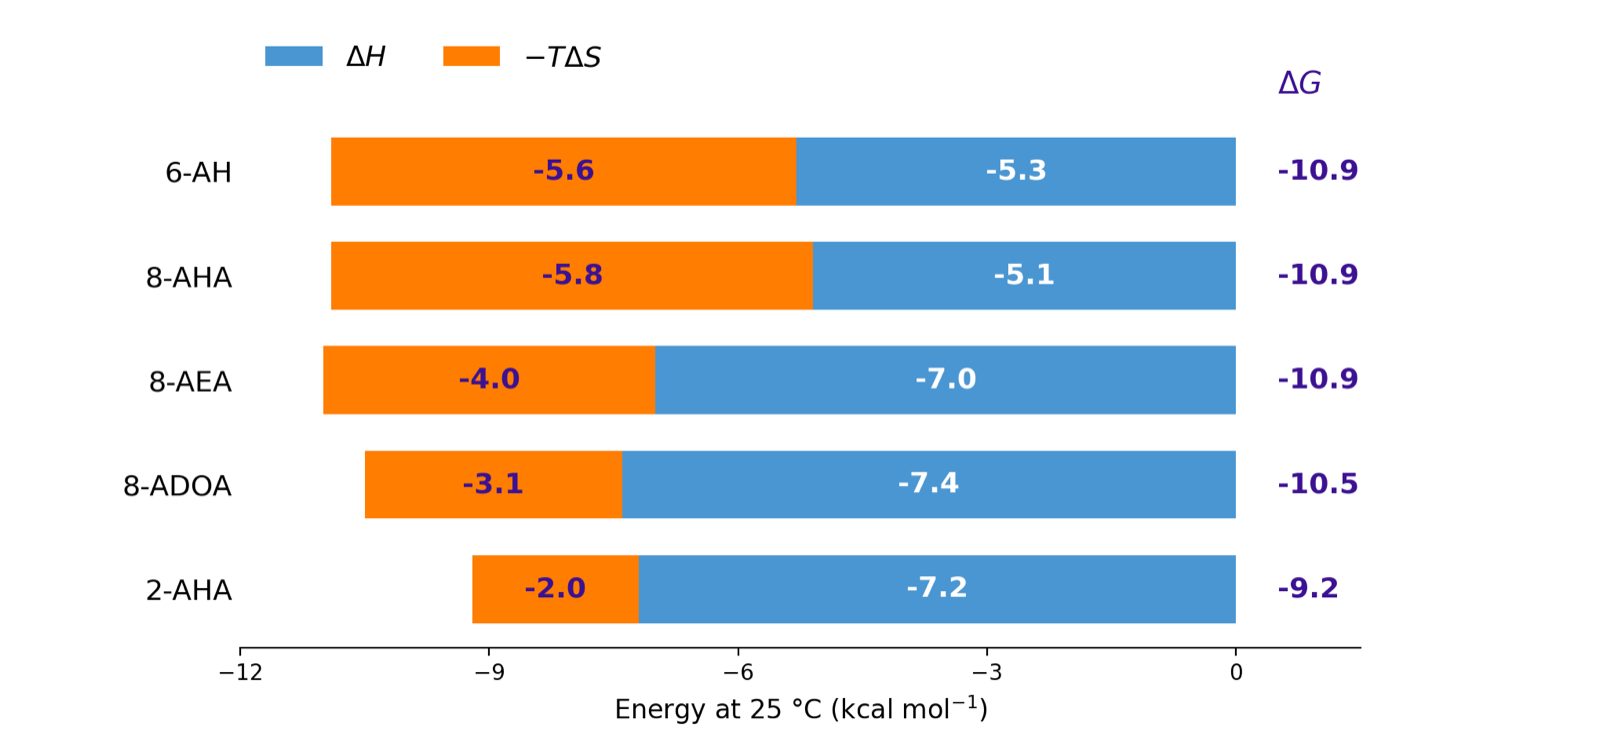
The figure comes from a van 't Hoff analysis. Each temperature gives one KD. Plot ln KD against 1/T: the slope gives ΔH and the intercept gives ΔS. The lab below runs that series for an enthalpy and an entropy that you set.
Set ΔH and ΔS, then press Play. At each temperature a single-cycle run gives KD, and a point drops on both plots. The two presets have the same ΔG at 25 °C, so the same KD, but a different split into ΔH and −TΔS.
Sign convention: ΔG = ΔH − TΔS = RT ln KD, with KD in M. A negative ΔG means binding. The lab sets the heat capacity change ΔCp to zero. Then ΔH and ΔS stay constant, and the van 't Hoff plot is a straight line with slope ΔH/R. If ΔH is negative, KD rises with temperature.
The series runs from 15 to 45 °C: the stage heater reaches 45 °C, and temperatures below room temperature need an external cooling device. Each run uses five 3-fold steps from KD/9 at 25 °C. The lab holds kon at the measured 7.7 × 10⁵ M−1s−1, and only koff follows KD. In a real series, kon also changes with temperature.
Picomolar apparent affinity, 14 hours of dissociation
How to read it
- Three estimates agree within a factor of three. Single-cycle kinetics give KD 10 nM (kon 7.7 × 10⁵ M−1s−1, koff 7.6 × 10⁻³ s−1). A 1:1 global fit of the multi-cycle run gives 17 nM. The dose-response fit gives 26 nM, an upper estimate: with 72 s injections, the lowest concentrations reached only about half of steady state.
- Same affinity, different driving force. 6-AH, 8-AHA and 8-AEA-cAMP all bind with ΔG of −10.9 kcal/mol. For 6-AH and 8-AHA, enthalpy and entropy contribute about equally. For 8-AEA, 8-ADOA and 2-AHA, enthalpy dominates at −7.0 to −7.4 kcal/mol.
- Very slow dissociation is measurable. After a fast drop in the first hour, the trastuzumab signal falls by less than 5 % over the next 13 h. The 1:1 fit does not follow the fast drop. The median of 64 molograms is koff 3.2 × 10⁻⁶ s−1 and KD 2.5 pM. That koff alone would predict a drop of about 14 % in 13 h. The late slope, under 5 %, means about 1 × 10⁻⁶ s−1 or slower, so read the fitted value as an upper bound. These are apparent values: an IgG binds Protein A at more than one site, so avidity adds to the affinity.
- What it does not show. Six of 64 molograms gave koff below 10−6 s−1, the lower end of the specification. Read those as "slower than 10−6 s−1", not as exact values. The van 't Hoff fits have weighted R² of 0.64 to 0.90. Compare the analogs by their pattern, not by single decimals.
Why it works
Ridges and grooves see the same buffer and the same temperature, so changes that act on both cancel. A temperature ramp from 25 to 43 °C moves the refractometric readout MD by thousands of pg/mm² while coherent mass density stays flat. The same cancellation lets you compare runs at different temperatures. The same cancellation keeps the baseline stable over the hours a slow dissociation needs.
Read more: the measured temperature ramp, baseline noise and drift, and reading and fitting sensorgrams.
More
- Paper: Oehninger, Bertinetti, Notova, Geiger, Herberg and Frutiger, High-throughput thermodynamic fingerprinting by DNA-directed focal molography, submitted 2026
- Specifications: rate constant ranges and analysis temperature
- Training: Single-cycle or multi-cycle kinetics?
- Documentation: Assay types and biomolecular interaction analysis