
Fc receptors and FcRn
Profile how an antibody's Fc region binds the Fc receptors of immune cells, and how FcRn binding changes with pH across six species. One chip per question.
The question
Which Fc receptors does my antibody bind, and does FcRn release it at neutral pH in the species I test in?
The Fc region decides how an antibody engages effector cells and how long it stays in circulation. Fcγ and Fcε receptors drive phagocytosis, ADCC and degranulation. FcRn binds IgG at pH 6.0 in the endosome and should release it at pH 7.4. Both answers need kinetics for many receptors under the same conditions.
The setup
| Chip | [Oligo|PEG] 8-plex chip; each receptor reaches its own molograms by DNA-directed immobilization (DDI) |
|---|---|
| Fc receptors | Fc Receptor Panel, six of its seven receptors in this run: FcγRI, FcγRIIa, FcγRIIb, FcγRIIIa, FcγRIIIb and FcεRI, eight molograms each |
| FcRn | FcRn Species Panel: human, cynomolgus, marmoset, mouse, rat and minipig FcRn |
| Analyte | Omalizumab in complex with IgE on the Fc receptors. Omalizumab and cetuximab alone on FcRn, 9.8 nM to 5 µM |
| Assay | Single-cycle kinetics (SCK). For FcRn, one run in MES pH 6.0 and one in PBST pH 7.4 |
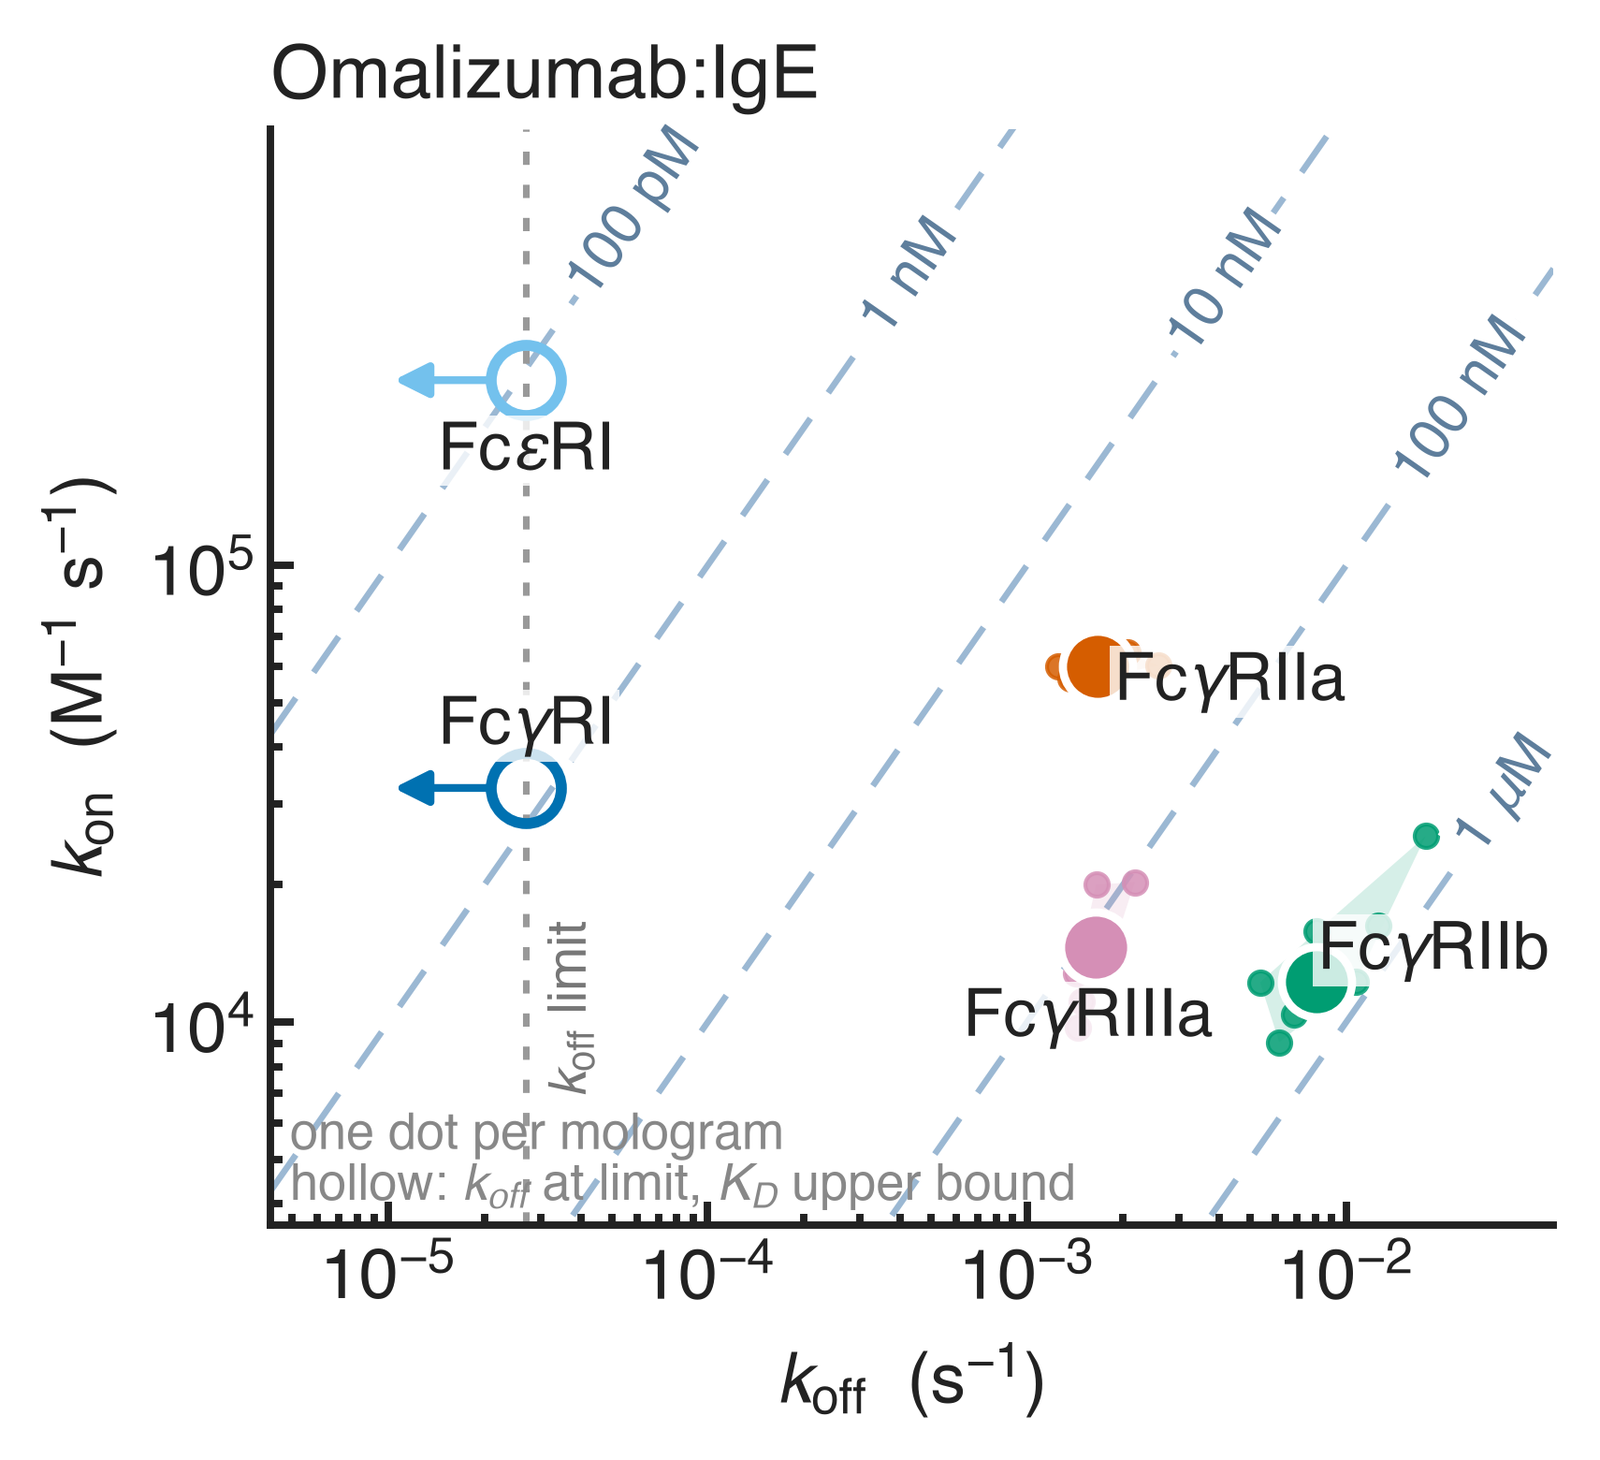
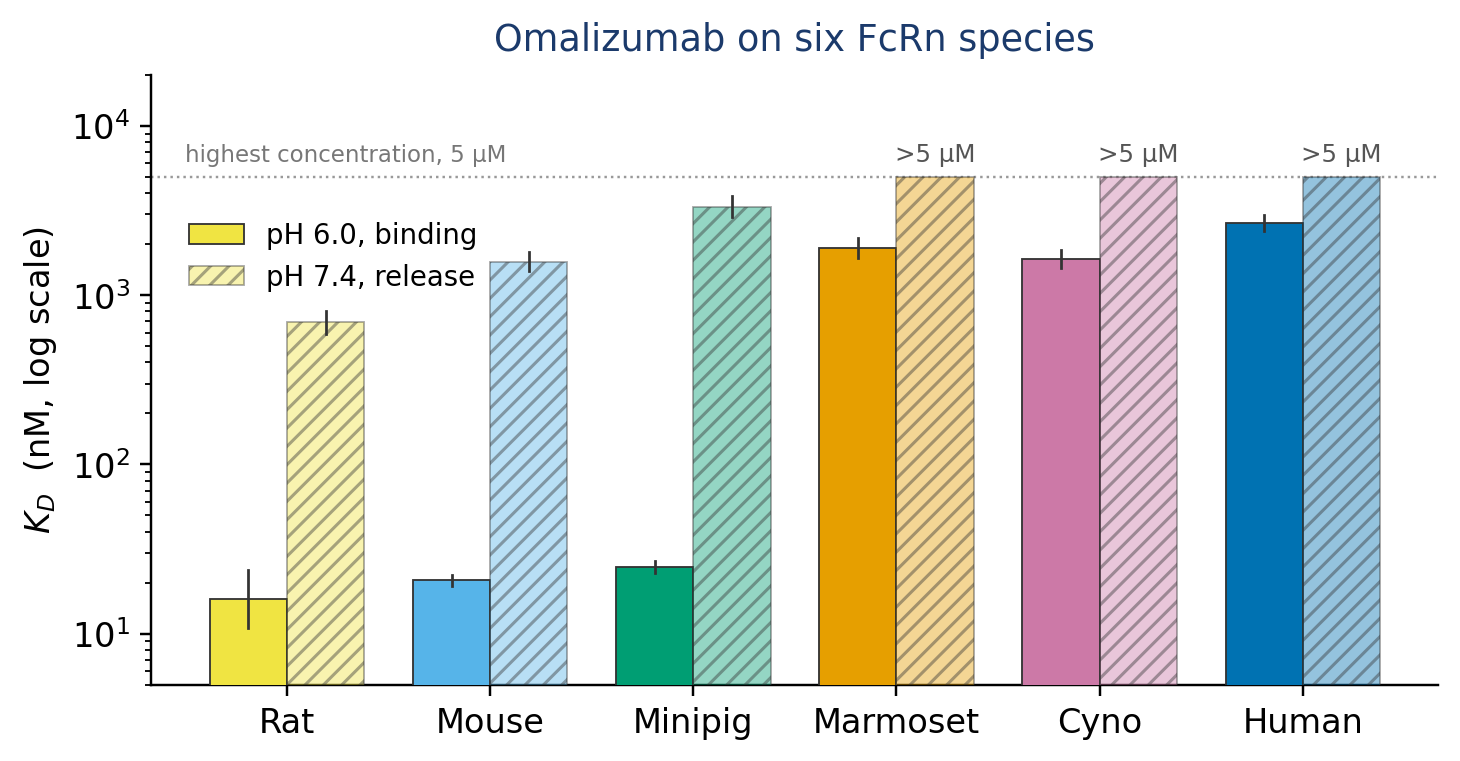
Each address follows a 1:1 model, with θ the fraction of receptor bound. For the Fc receptors, kon and koff are read from the measured rate map below. For FcRn, KD comes from the measured bar chart below. Play it, then switch to the FcRn panel and change the pH.
In the animation, the immune complex flows at 100 nM and omalizumab at 1 µM. Each injection lasts 300 s, followed by 600 s of buffer. FcRn kon is 105 M−1 s−1 for all species and both pH values, so pH acts on koff only. The panel descriptions do not map receptors or species to sequences, so the order follows the panel tables. Position 8 is the oligo-only reference on both panels.
Measured result
How to read it
- Each receptor has its own position. FcεRI and FcγRI bind tightest, with apparent KD at or below 0.11 nM and 0.83 nM. Their koff is at the determination limit. Omalizumab blocks the FcεRI binding site on IgE, so the FcεRI signal most likely comes from free IgE in the mixture, not from the complex.
- Activating and inhibitory receptors differ. FcγRIIa (activating) binds the immune complex with a median apparent KD of 29 nM, tighter than a single IgG because of avidity. FcγRIIb (inhibitory) binds at 0.68 µM, about 24 times weaker (n = 8 and 7 molograms).
- Rodent and minipig FcRn bind about 60 to 170 times more tightly than primate FcRn. At pH 6.0, KD is 16 to 25 nM. At pH 7.4 they keep weak µM affinity: 0.7 µM (rat), 1.6 µM (mouse) and 3.3 µM (minipig).
- Primate FcRn binds in the low µM range. Human, cynomolgus and marmoset FcRn give KD of 1.6 to 2.7 µM at pH 6.0. At pH 7.4 they show no saturable binding up to 5 µM. Cetuximab gives the same species ranking.
- What it does not show is half-life or effector function. These values are for one antibody in one run each, not specifications. Set the profile against cell-based assays and in vivo data.
Why it works
Each receptor sits on its own molograms, addressed by its oligo, so one injection reads all receptors under the same conditions. The MACS Matchmaker reads coherent mass density: mass that binds in the ridge pattern. Changes in the bulk buffer act on ridges and grooves alike and add little to that signal.
Read more: how matched grooves keep the background out, why shared changes cancel, and reading CMD together with the refractometric readout MD.
More
- Application: Fc Receptor Panel
- Application: FcRn Species Panel
- Documentation: Fc receptor protocol
- Training: Ready panels: the layout and controls are already designed