
Developability: polyreactivity and plasma protein binding
Two early checks on the intact antibody, on the same instrument as the target kinetics. Does it bind surfaces it should not? How much plasma protein does it pick up?
The question
Does my candidate bind things it should not, in buffer and in plasma?
Cross-interaction has been associated with faster antibody clearance in mice. Polyreactivity is one of several developability flags, not a reliable predictor on its own. For plasma, the question is whether plasma protein binds to it, and whether it stays bound. Both questions usually need separate platforms. Here, polyreactivity is checked for all candidates, and plasma binding for the ones that pass. See where the panels fit in antibody development.
Polyreactivity
The Polyreactivity Panel carries ligands that each stand for one kind of unwanted interaction: charge, lipid, glycan, plasma protein or nucleic acid. The antibody is titrated over all of them at once.
The setup
| Chip | 8-plex DNA chip; each ligand reaches its molograms by DNA-directed immobilization (DDI) |
|---|---|
| Ligands | Polyreactivity Panel positions 1 to 8: Protein A/G (capture control), dsDNA, human serum albumin (HSA), insulin, human lysozyme, aminocardiolipin, aminoheparin, α1-acid glycoprotein (AGP) |
| Analyte | Six therapeutic antibodies, one per run: briakinumab, rituximab, ravulizumab, adalimumab, ustekinumab, eculizumab |
| Assay | Single-cycle titration: a blank, then 111 nM, 333 nM, 1 µM and 3 µM, 120 s each. One antibody per cycle on the same chip, regenerated and loaded again in between |
| Readout | Response at the end of the 3 µM step, blank-corrected, divided by the ligand mass on the same mologram and averaged over eight molograms. The Polyreactivity Index is the mean over the seven panel ligands; its detection limit is 0.03. Retention is the share of signal left 200 s after the injection, on the ligand with the largest response |
Each position follows a 1:1 model during the titration from the setup table. Play it with the polyreactive antibody, then switch to the clean antibody and play it again. Step 5 shows the plasma protein binding assay.
In the animation, the panel ligands share one koff, set by the measured HSA retention of 0.29 after 200 s. Their KD of 3 µM and the bar heights are not measured. Only the order of the bars follows the measured result. In step 5, bound protein is set to 50 % of the captured antibody, and the toggle does not apply.
Measured result
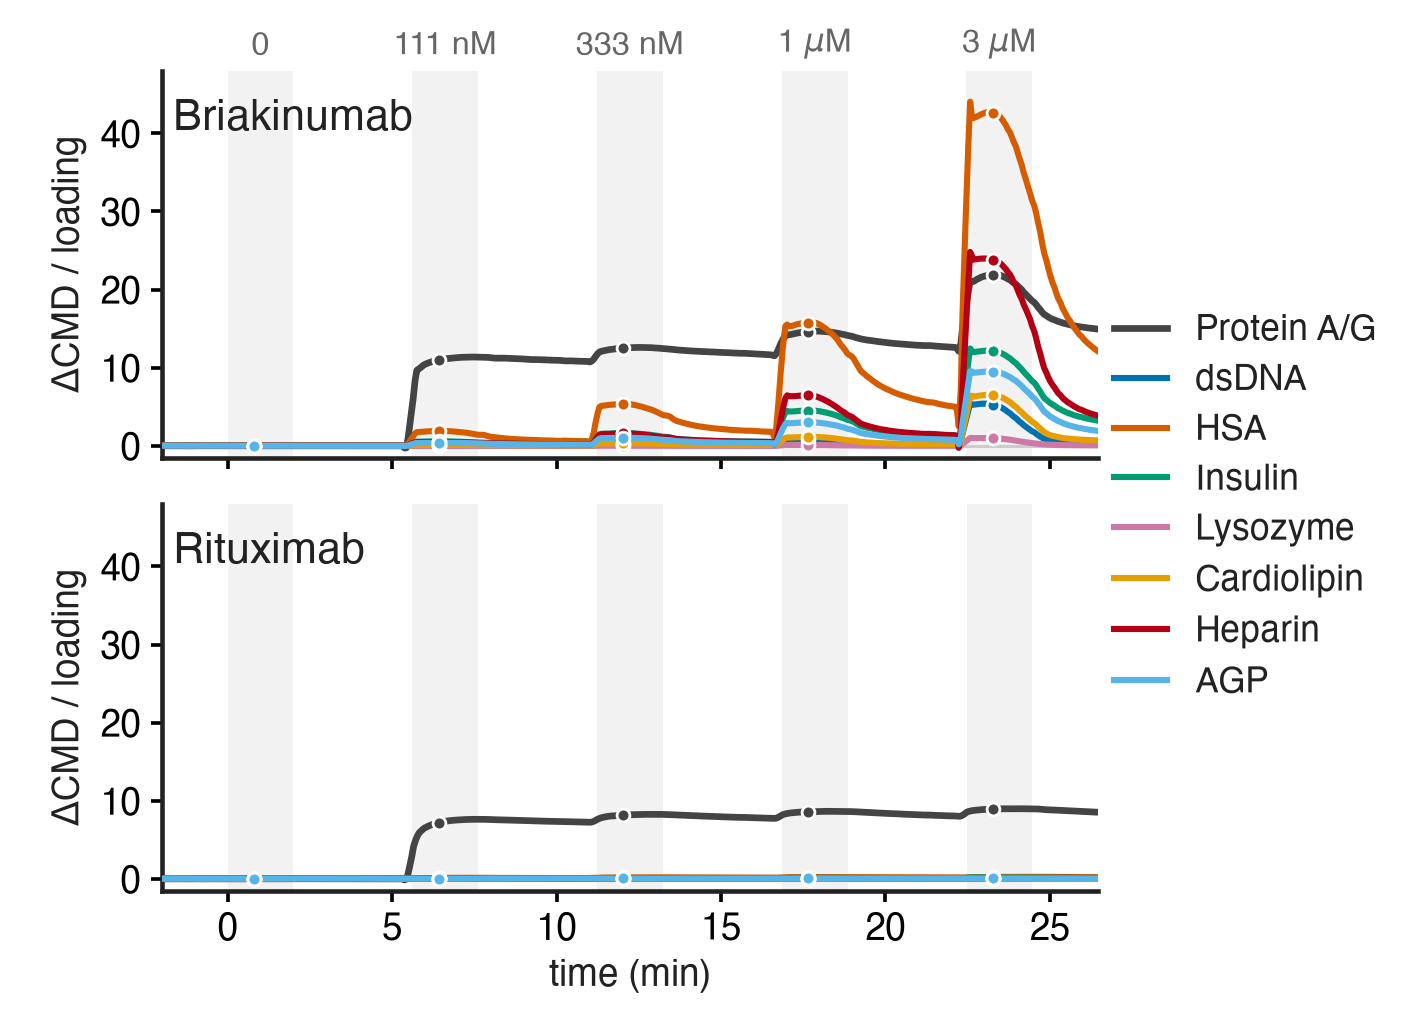
How to read it
- Protein A/G confirms capture. Both antibodies bind the Protein A/G control from the first step. So both antibodies reached the surface.
- Briakinumab binds every panel ligand. The signal rises with each step, most on HSA, then heparin and insulin. It falls again once the injection stops.
- Rituximab stays near zero. Its small index of 0.08 was already half present at 111 nM and hardly grew with concentration, so it is not classified as polyreactive.
- One index per antibody. Five of six antibodies scored above the detection limit, from 0.08 to 8.8. Briakinumab scored 69-fold above ustekinumab, which binds the same target. Ravulizumab scored 0.30, while eculizumab, against the same target, stayed below the limit.
- Kinetics come with it. The binding is broad, but most of it washes off: 200 s after the injection, 0.29 of the HSA signal remains.
- What it does not show is clearance in vivo; the panel ligands stand in for surfaces in the body. The index ranks antibodies at 3 µM. It is not an affinity and has no fixed pass or fail threshold.
Plasma protein binding
Plasma protein binding is an assay, not a panel. Each antibody is captured on its own molograms, then undiluted pooled human EDTA plasma or serum flows over the chip. See the capture adapters.
The setup
| Capture | An anti-Fc antibody placed by DDI binds the Fc region of each antibody. All six antibodies on one chip, eight molograms each, with an anti-Fc and a DNA reference |
|---|---|
| Antibodies | The same six: rituximab, eculizumab, ustekinumab, ravulizumab, briakinumab, adalimumab |
| Sample | Undiluted pooled human EDTA plasma, and undiluted serum in a separate measurement |
| Readout | Bound protein mass at the end of the last injection, as a percentage of the captured antibody mass (CMD). No reference subtraction. Eight values per antibody and matrix |
Measured result
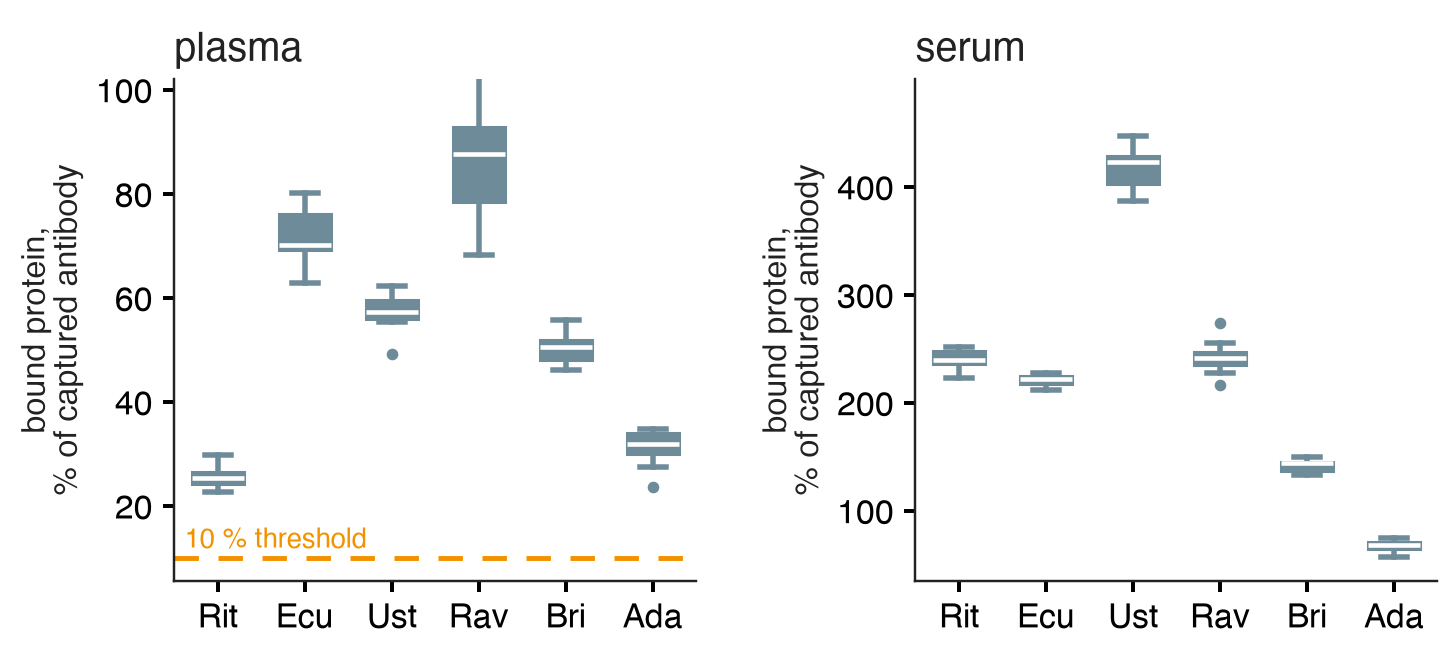
How to read it
- Each antibody picks up its own amount of plasma protein. Plasma medians: rituximab 25 %, adalimumab 32 %, briakinumab 51 %, ustekinumab 57 %, eculizumab 70 %, ravulizumab 88 %.
- Serum gives a different order. Above 100 %, more protein mass bound than antibody was captured. Serum medians are higher: adalimumab 68 %, briakinumab 144 %, eculizumab 221 %, rituximab 240 %, ravulizumab 241 %, ustekinumab 423 %.
- Choose the matrix that matches the question. In this set, the plasma ranking did not predict the serum ranking.
- What it does not show is which proteins bound, or what the binding does to function or clearance. Captured amounts differed about tenfold between antibodies, which affects the percentages.
Why it works
The MACS Matchmaker reads coherent mass density: only mass that binds in the line pattern of the mologram builds the signal. Proteins that stick evenly to ridges and grooves add no coherent signal, so plasma and serum can flow over the chip. Matched grooves keep this adsorption even, also in crude samples.
Read more: how backfilling matches the grooves, why shared changes cancel, and measuring in serum, plasma and lysate.
More
- Application: Polyreactivity Panel
- Application: Plasma protein binding
- Products: Polyreactivity Panel ligands and capture adapters
- Training: Ready panels: the layout and controls are already designed